Visitor movement information is based on mobility data and is sourced from Environics Analytics. It shows where visitors go when they travel to and within the province and includes information for visitors from Canada (including Nova Scotians travelling within the province) and the United States.
Visitor Movement
2026 Visitor Movement Indicators
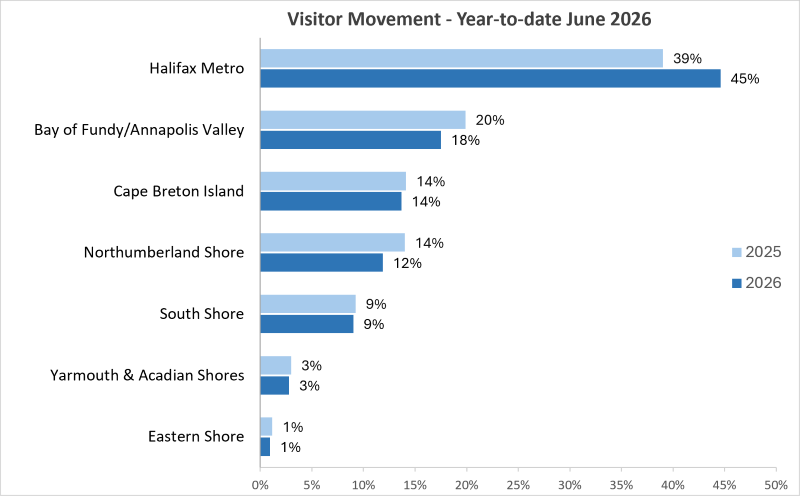
Visitor Movement - All Canadian & US Visitors
The following graph illustrates the percentage of total nights spent in each tourism region during trips taken in the first six months of 2026 by North American overnight visitors, including Nova Scotians. For example, 45% of all nights between January and June of 2026 were spent in the Halifax Metro tourism region, compared with 39% over the same time period in 2025.
Seasonal Visitor Movement - All Canadian & US Visitors
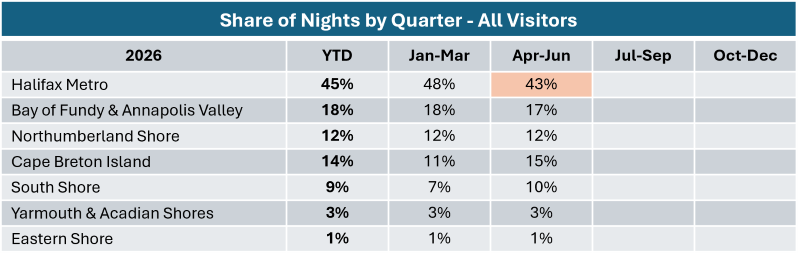
The following table illustrates regional visitation by season.
Looking at the first two quarters of 2026, there is minimal variation with respect to where visitors spend their nights in the province, by region.
Seasonal Visitor Movement - Nova Scotians
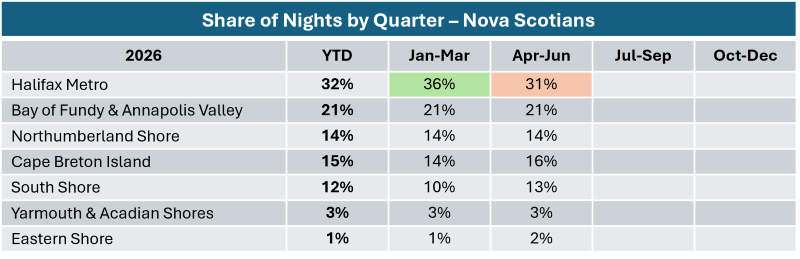
The following table illustrates regional visitation by Nova Scotians.
Among Nova Scotians traveling within the province, regions outside of Halifax Metro receive a higher share of nights during the April to June period, compared with the first three months of 2026.
Seasonal Visitor Movement - Visitors from Atlantic Canada
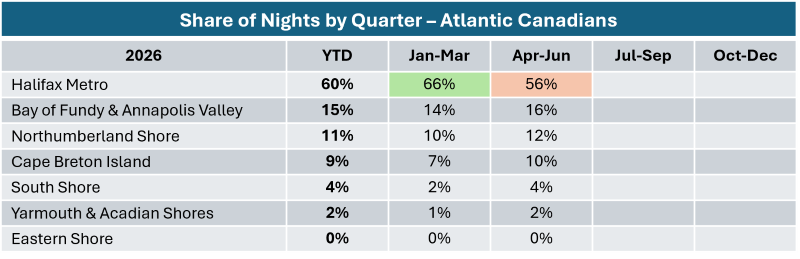
The following table illustrates regional visitation among visitors from Atlantic Canada (PE, NB, NL).
Atlantic Canadian visitors to Nova Scotia spend a larger share of their nights in Halifax during the January to March period compared with the April to June period.
Seasonal Visitor Movement - Visitors from Quebec/Ontario/Western & Northern Canada
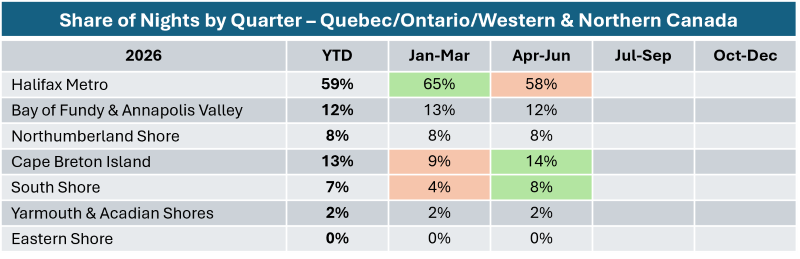
The following table illustrates regional visitation among visitors from Quebec, Ontario, and Western/Northern Canada.
The information illustrates that visitors spend a larger share of their nights in Halifax during the January to March period compared with the April to June period.
In contrast, the share of nights spent in Cape Breton and South Shore increase from in April to June as compared to the earlier months.
Seasonal Visitor Movement - Visitors from the United States
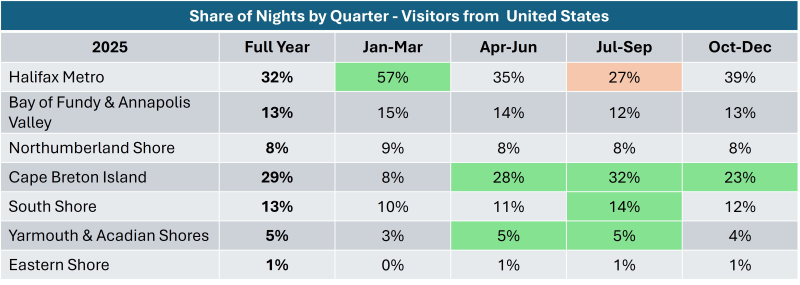
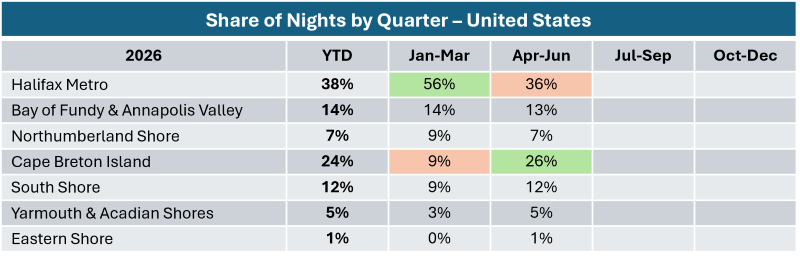
This table illustrates regional visitation among visitors from the United States.
The information illustrates the popularity of Cape Breton among American visitors during the April to June period. American visitors spend a smaller share of their nights in the Halifax region in the April to June period, compared with January to March.
2025 Visitor Movement Indicators
Visitor Movement - All Canadian & US Visitors
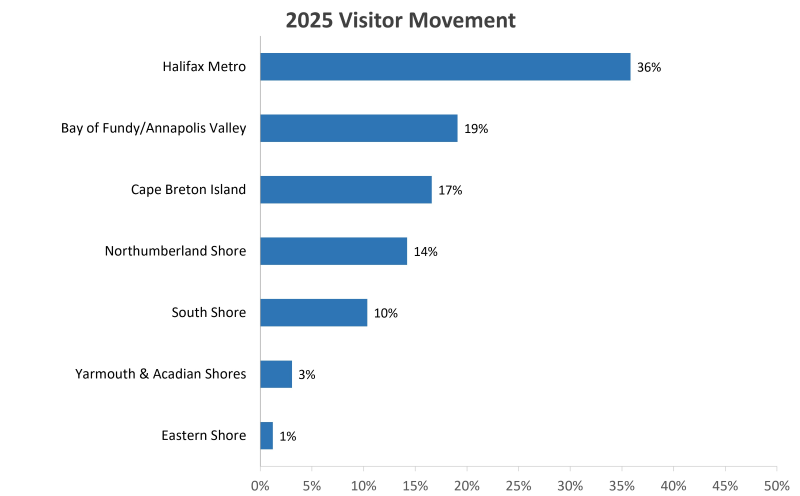
The following graph illustrates the percentage of total nights spent in each tourism region during trips taken by North American overnight visitors, including Nova Scotians. For example, 36% of all nights in 2025 were spent in the Halifax Metro tourism region.
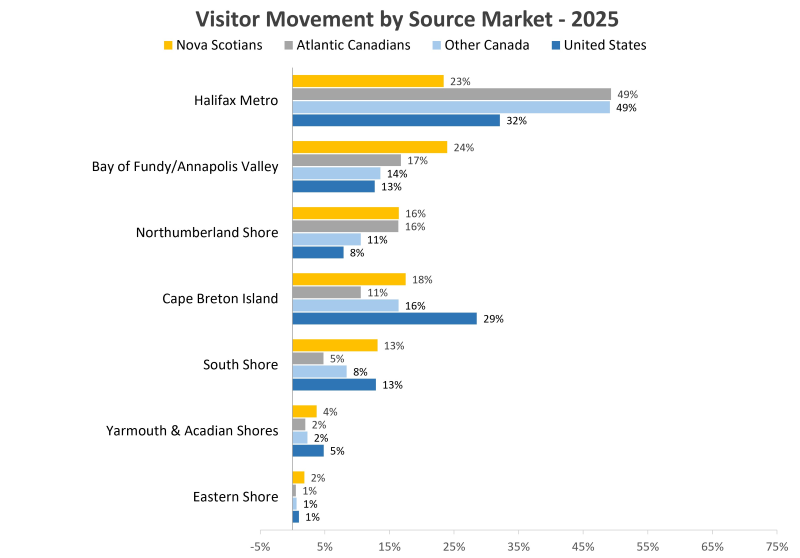
Visitor Movement - All Canadian & US Visitors by Source Market
This graph illustrates the percentage of total nights spent in each tourism region, by source market. For example, 32% of the nights spent by visitors from the United States were in the Halifax Metro tourism region, compared with 49% for visitors from Quebec/Ontario/Western Canada.
Visitors from the United States are considerably more likely than those from elsewhere to spend time in Cape Breton as part of their Nova Scotia trip.
Seasonal Visitor Movement - All Canadian & US Visitors
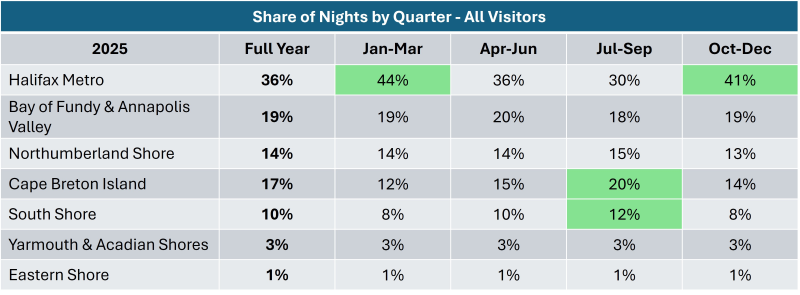
The following table illustrates regional visitation by season.
The Halifax region receives a higher share of nights spent in the province between October and March, compared with its share of nights in the April to September period.
Cape Breton and South Shore receive a higher share of nights among those visiting Nova Scotia between July and September.
Seasonal Visitor Movement - Nova Scotians
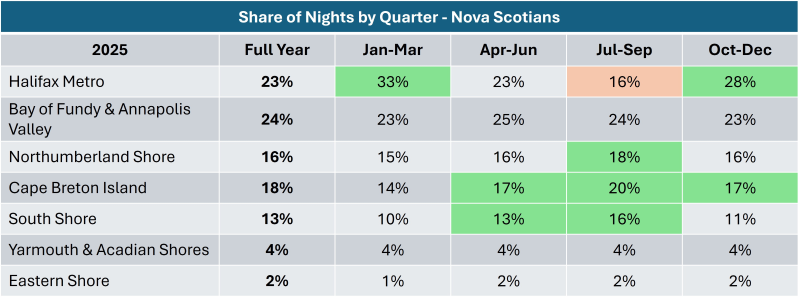
The following table illustrates regional visitation by Nova Scotians.
Among Nova Scotians traveling within the province, regions outside of Halifax Metro receive a higher share of nights during the April to September period.
Seasonal Visitor Movement - Visitors from Atlantic Canada
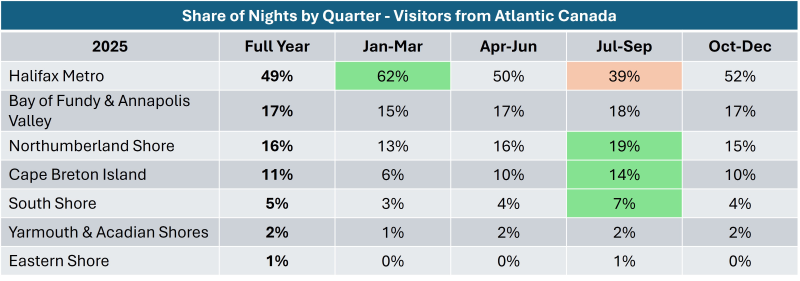
The following table illustrates regional visitation among visitors from Atlantic Canada (PE, NB, NL).
Atlantic Canadian visitors to Nova Scotia in the July to September period are more likely to visit Cape Breton, South Shore, and Northumberland Shore, compared with the rest of the year.
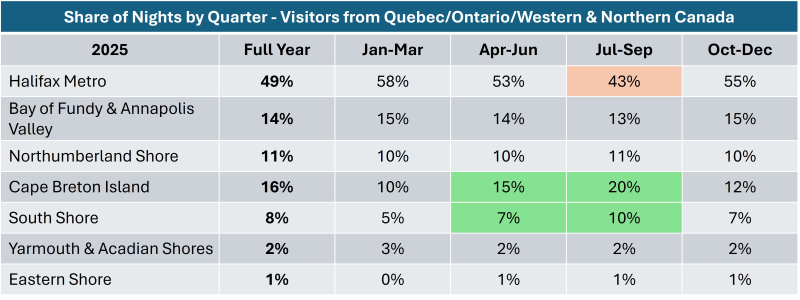
Seasonal Visitor Movement - Visitors from Quebec/Ontario/Western & Northern Canada
The following table illustrates regional visitation among visitors from Quebec, Ontario, and Western/Northern Canada.
The information illustrates that visitors spend a smaller share of their nights in Halifax during the July to September period, compared with the October to March period.
Cape Breton and South Shore receive a significant share of visitor nights during the April to September period.
Seasonal Visitor Movement - Visitors from the United States
This table illustrates regional visitation among visitors from the United States.
The information illustrates the popularity of Cape Breton among American visitors, particularly during the April to December period.