Tourism Nova Scotia gathers and reports tourism statistics on behalf of the tourism industry. These statistics help inform our decision-making, help describe visitors to Nova Scotia, and can be used by tourism businesses and organizations for planning and business development. As tourism indicators are compiled from several sources, data becomes available at different times. Tourism Nova Scotia reports the most up-to-date statistics available so reporting timelines for each indicator may differ.
January to December 2025 Visitation
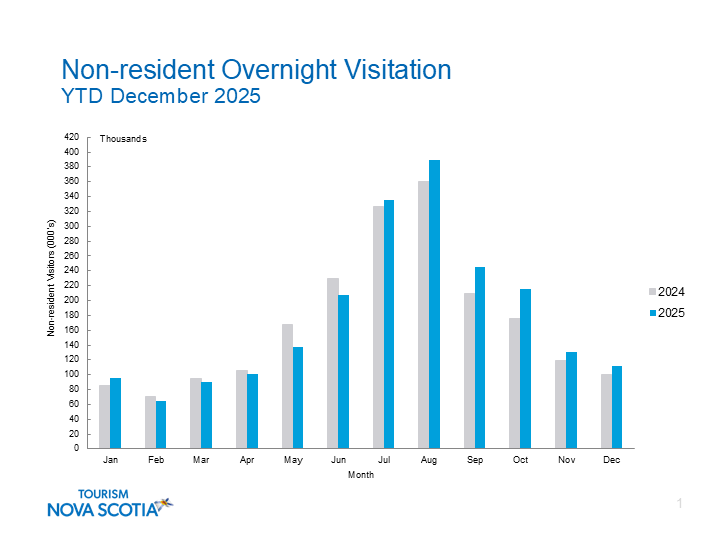
In 2025, Nova Scotia welcomed 2.1 million visitors, up 4% from 2024 (79,000 more visitors). Following a slow start, the province saw strong growth in visitation in the final six months of the year.
Visitation by road totalled 1.3 million (up 3%, or 37,000 more visitors, compared with the same period in 2024), while 836,000 visitors arrived by air, an increase of 5% from 2024 (42,000 more visitors).
Nova Scotia hosted 891,000 visitors from Atlantic Canada, an increase of 5% from 2024 (46,000 more visitors).
Visitation from Quebec increased significantly, with 128,000 visitors arriving in 2025, up 22%, or 23,000 more visitors compared with 2024. 99,000 of the visitors from this market arrived by road (up 38% from 2024), while arrivals from Quebec by air declined by 12%.
584,000 visitors arrived from Ontario in 2025, down 2% from 2024 (13,000 fewer visitors). Ontario remains Nova Scotia’s largest source market outside of Atlantic Canada, accounting for 28% of visitation to Nova Scotia.
2025 saw 236,000 visitors arrive to Nova Scotia from Western Canada (an increase of 7% or 15,000 more visitors compared to 2024).
Internationally, visitation from the United States was down by 5% from 2024 (10,000 fewer visitors), with 179,000 visitors arriving in 2025. Visitation by air increased by 2%, while visitation by road declined by 12% (12,000 fewer visitors).
105,000 visitors arrived from overseas markets, a 21% increase from 2024 (18,000 more visitors). Overseas visitors represent 5% of all visitation to Nova Scotia.
2024 Visitation to Nova Scotia
2024 Nova Scotia Visitation Statistics
2024 Tourism Performance Infographic
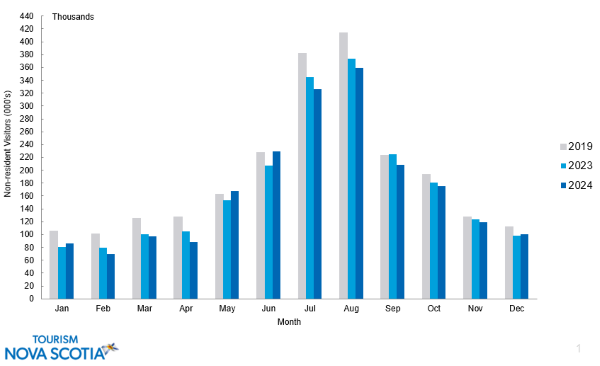
Visitation to Nova Scotia in 2024 declined slightly following strong growth in 2023. In 2024, Nova Scotia welcomed just over 2 million non-resident visitors, a decrease of 2% (or 43,000 fewer visitors) compared with 2023.
Of these 2024 visitors, 1.3 million arrived by road (down 7%, or 88,000 fewer visitors compared with 2023). Visitation to Nova Scotia by air increased by 6% (or 45,000 more visitors) compared with 2023, with 777,000 visitors arriving by air in 2024.
Visitation from Atlantic Canada, Nova Scotia’s largest market, continues to see softness in visitation post-pandemic. Specifically, 860,000 Atlantic Canadians visited Nova Scotia in 2024, a decrease of 2% compared with 2023 (20,000 fewer visitors). Visitation from Quebec also dipped to 104,000, a decrease of 4% compared with 2023 (4,000 fewer visitors).
Following strong growth in 2023, visitation from Ontario declined in 2024, with 586,000 visitors arriving, a decrease of 6% (38,000 fewer visitors) compared with 2023. Ontario remains Nova Scotia’s second-biggest market, accounting for 29% of visitation to Nova Scotia in 2024.
Visitation to Nova Scotia from Western Canada increased in 2024, reaching 218,000 visitors, up 1% from 2023 (or 2,000 more visitors).
Visitation from the US continued to increase, with 172,000 visitors arriving in 2024 (an 11% increase, or 17,000 more visitors over 2023). This market continues to see challenges in terms of recovery post-pandemic.
Visitation from overseas markets was stable compared with 2023, with 88,000 visiting Nova Scotia in 2024.
Non-resident Visitors to Nova Scotia:
About Visitation Statistics
Visitation statistics are compiled from a variety of sources, including:
- In-person surveys administered to passengers at the Halifax Stanfield International Airport
- Motor vehicle enumeration at the Nova Scotia – New Brunswick border
- Passenger information from ferry operators
- The Nova Scotia Visitor Exit Survey
- Data from Halifax International Airport Authority
- Visitor data from provincial and community visitor information centres
- Cruise passenger data from Halifax Port Authority and Sydney Ports Corporation
- Attendance data from select tourism operators
These statistics reflect the combined efforts of tourism businesses, organizations, communities, and governments, and include activities by both Nova Scotians and non-resident visitors. There are many factors that contribute to tourism industry performance including events, weather, gas prices, air capacity, currency fluctuations, geo-political circumstances, and industry initiatives such as marketing. Tourism Nova Scotia is just one organization among many contributing to tourism growth. We support tourism growth through marketing in key national and international markets, support for experience and business development, and visitor servicing. For more information about Tourism Nova Scotia's strategy and performance, please see Plans & Reports.